Add Yield Monitor Value
Something went wrong. Please try again later...
 Watching yield monitor bushel numbers rise and fall as the combine cuts round after round can be both puzzling and exciting. Who doesn’t want that 300-bushel corn moment to spread across a larger section of the field?
Before this technology, farmers relied on human observation, wagons, trucks or weigh scale tickets to judge a field.
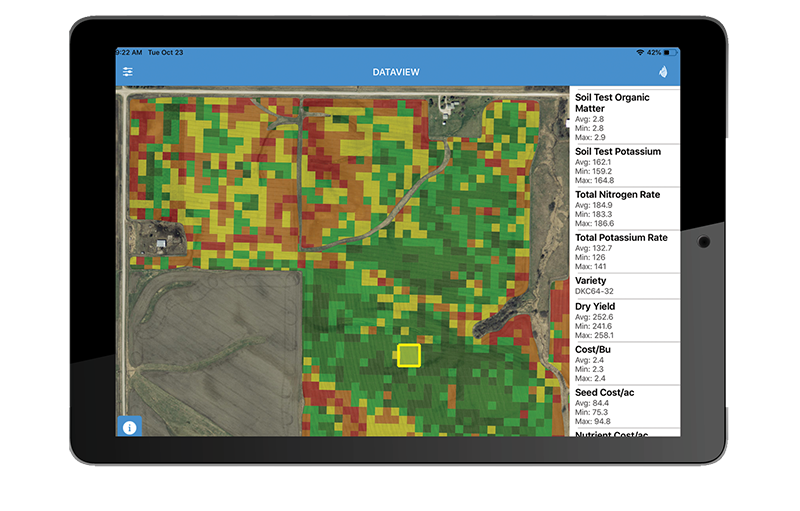
“If you think back years ago, the reason growers got hooked on nitrogen is they made the visual connection between yellow corn, lower yields and nitrogen,” says Dan Frieberg, founder and vice president of Technical Services for Premier Crop Systems. “Today, visual observation remains important. But now, growers can couple that with viewing many as-applied map layers on their iPad or monitor as they’re going through the field to offer instant feedback.”
Frieberg and his group have analyzed field data for 23 crop seasons across numerous Corn Belt states, helping farmers merge sub-field agronomics with field-level economics to maximize profits.
In this final observation of the season, most growers understand the issues seen in fields; they’re just not sure of the yield impact.
Numerous companies offer data solutions and tools to help farmers find answers. For example, Corteva Agriscience provides various Granular® tools to meet numerous farming challenges—from agronomics and scouting to ROI. The technology offers real-time, field-by-field information. Growers can use that to manage inputs and maximize future yield.
John Fulton, Extension Precision Ag Specialist at Ohio State University, suggests that farmers take data layer maps to the field, like remote sensing imagery and as-planted data, to gain insights during harvest.
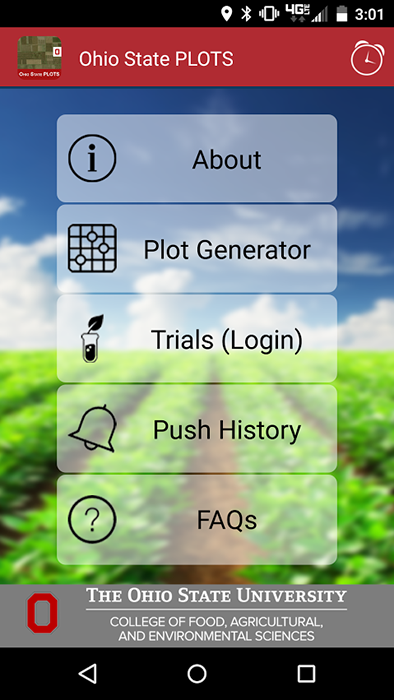
“Within our research farm, we like to predefine areas of each field to watch during harvest. With the spatial scouting information we’ve recorded in research trials using our Ohio State PLOTS app, we can really pay attention to these areas during harvest. Along with the yield monitor numbers, we’ll watch for visual indication of compaction, planter issues, nutrient deficiencies like potassium, or dicamba drift.”
Fulton tells a story on the importance of visual learning throughout the season. “For example, scouting in-season helped determine the location of some dicamba drift damage, which helped us spatially mark those areas to watch for yield issues at harvest,” he says. “If the drift wasn’t visually caught earlier, we might see a yield difference and not know why.”
Sitting in the combine during harvest is a good time to consider what you can do in the future in each field that either maintains or improves profitability by field zone, says Fulton. “I think a lot of guys, if they have the technology, are examining variable-rate, input-use efficiency—as that drives economics.”
Frieberg adds that while every grower has seen bin-busting corn yields in an area of a field, the most exciting part is when a grower wants to learn why. “Once they start to answer that question, it leads them to pursue more data to figure out what makes that area special, and how can it be replicated in more areas of a field.”
A real eye-opener, Frieberg says, is to watch various input cost data layers during harvest. “Those growers with variable-rate seeding or nitrogen or other trials can see the cost per acre and compare it to the yield numbers as they go up and down.”
One of the best outcomes from using yield monitor and visual data is making quicker hybrid/variety buying decisions, Frieberg says. “If you have all your hybrid and variety planting maps, watching how they yield in different management zones, you can take notes and have impressions formed before the sales rep arrives with his early-order sheet.”
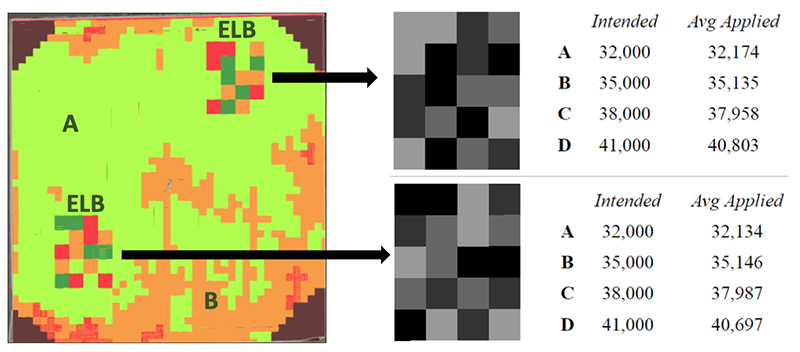
Freiberg says Premier Crop Systems has developed an automated, on-farm trial prescription system where the planter places “Learning Blocks” in various field locations. “It gives farmers the ability to test variable-rate seeding or nutrient rates in two- to three-acre replicated tests to determine optimal rates by field zone,” he says. “And the yield monitor readout offers a quick look at results while driving through these blocks.”
Fulton suggests growers challenge themselves with whatever technology tools they have—to learn them and figure out how to use them best to explain the yield results. “Use the data to help replay the season to confirm what you’re thinking or discover what happened.”
Content provided by DTN/Progressive Farmer
Find expert insights on agronomics, crop protection, farm operations and more.