5 tips for maximizing yield maps
Something went wrong. Please try again later...
Data collection and yield maps are common these days, but it’s important to be collecting and utilizing your data with intention. It’s easy to get lost in the data, collect data incorrectly and even reach the wrong conclusions.
Our top 5 tips for getting more from your yield maps come from Anthony Lackore, Area District Leader, Western Corn Belt for Corteva Agriscience, and N. Dennis Bowman, Extension Digital Agriculture Specialist at the University of Illinois Urbana-Champaign.
“One of the big challenges that we've had as an industry over the last decade is that there's been a lot of data collection, but there have been very few advisers and partners and farmers who have really used that data to help answer key questions on their farm operation. It's worthless if you don't put it to use, and use it to make key decisions for your farm.” - Anthony Lackore
Start with the end in mind, he says, and one or two questions you want to answer. Many farmers question, for example, whether it pays to plant soybeans early.
“Historically, we have always as an industry prioritized planting corn in the spring, followed by soybeans,” says Lackore. But over the last five years, research has shown a yield advantage to planting soybeans early.
“Small plot research shows that, but farmers had never been able to really answer that question on their own farms,” he says. “So, we’ve worked with farmers one-on-one to help them answer that question.”
With today’s technology, it’s possible to aggregate end-of-season data from the planter monitor as well as the yield map to hybrid performance, fertility, drainage problems in low-lying areas, variable rate seeding and equipment choices.
Bowman agrees that for many growers, yield mapping is an untapped resource that could boost profits.
“A lot of the yield data gets recorded and never looked at,” he says.
Make a conscious effort to go through data, Bowman urges, and the sooner, the better, when the weather and all the timings of different procedures are still fresh in your mind. Then, keep those maps so when you get next year’s yield maps, you can go back and look for similar patterns.
One of the first farmers Bowman knew with yield maps in the combine had accumulated three- or four-years’ worth. They noticed that an area of a field wasn’t yielding well and started stacking the maps together to turn them into profit maps, figuring costs and current prices for corn and soybeans, and determining how much money the farmer was making in different areas of the field.
“When we looked at that over several years, we noticed that there was a marginal area in this field where they never made money,” Bowman recalls.
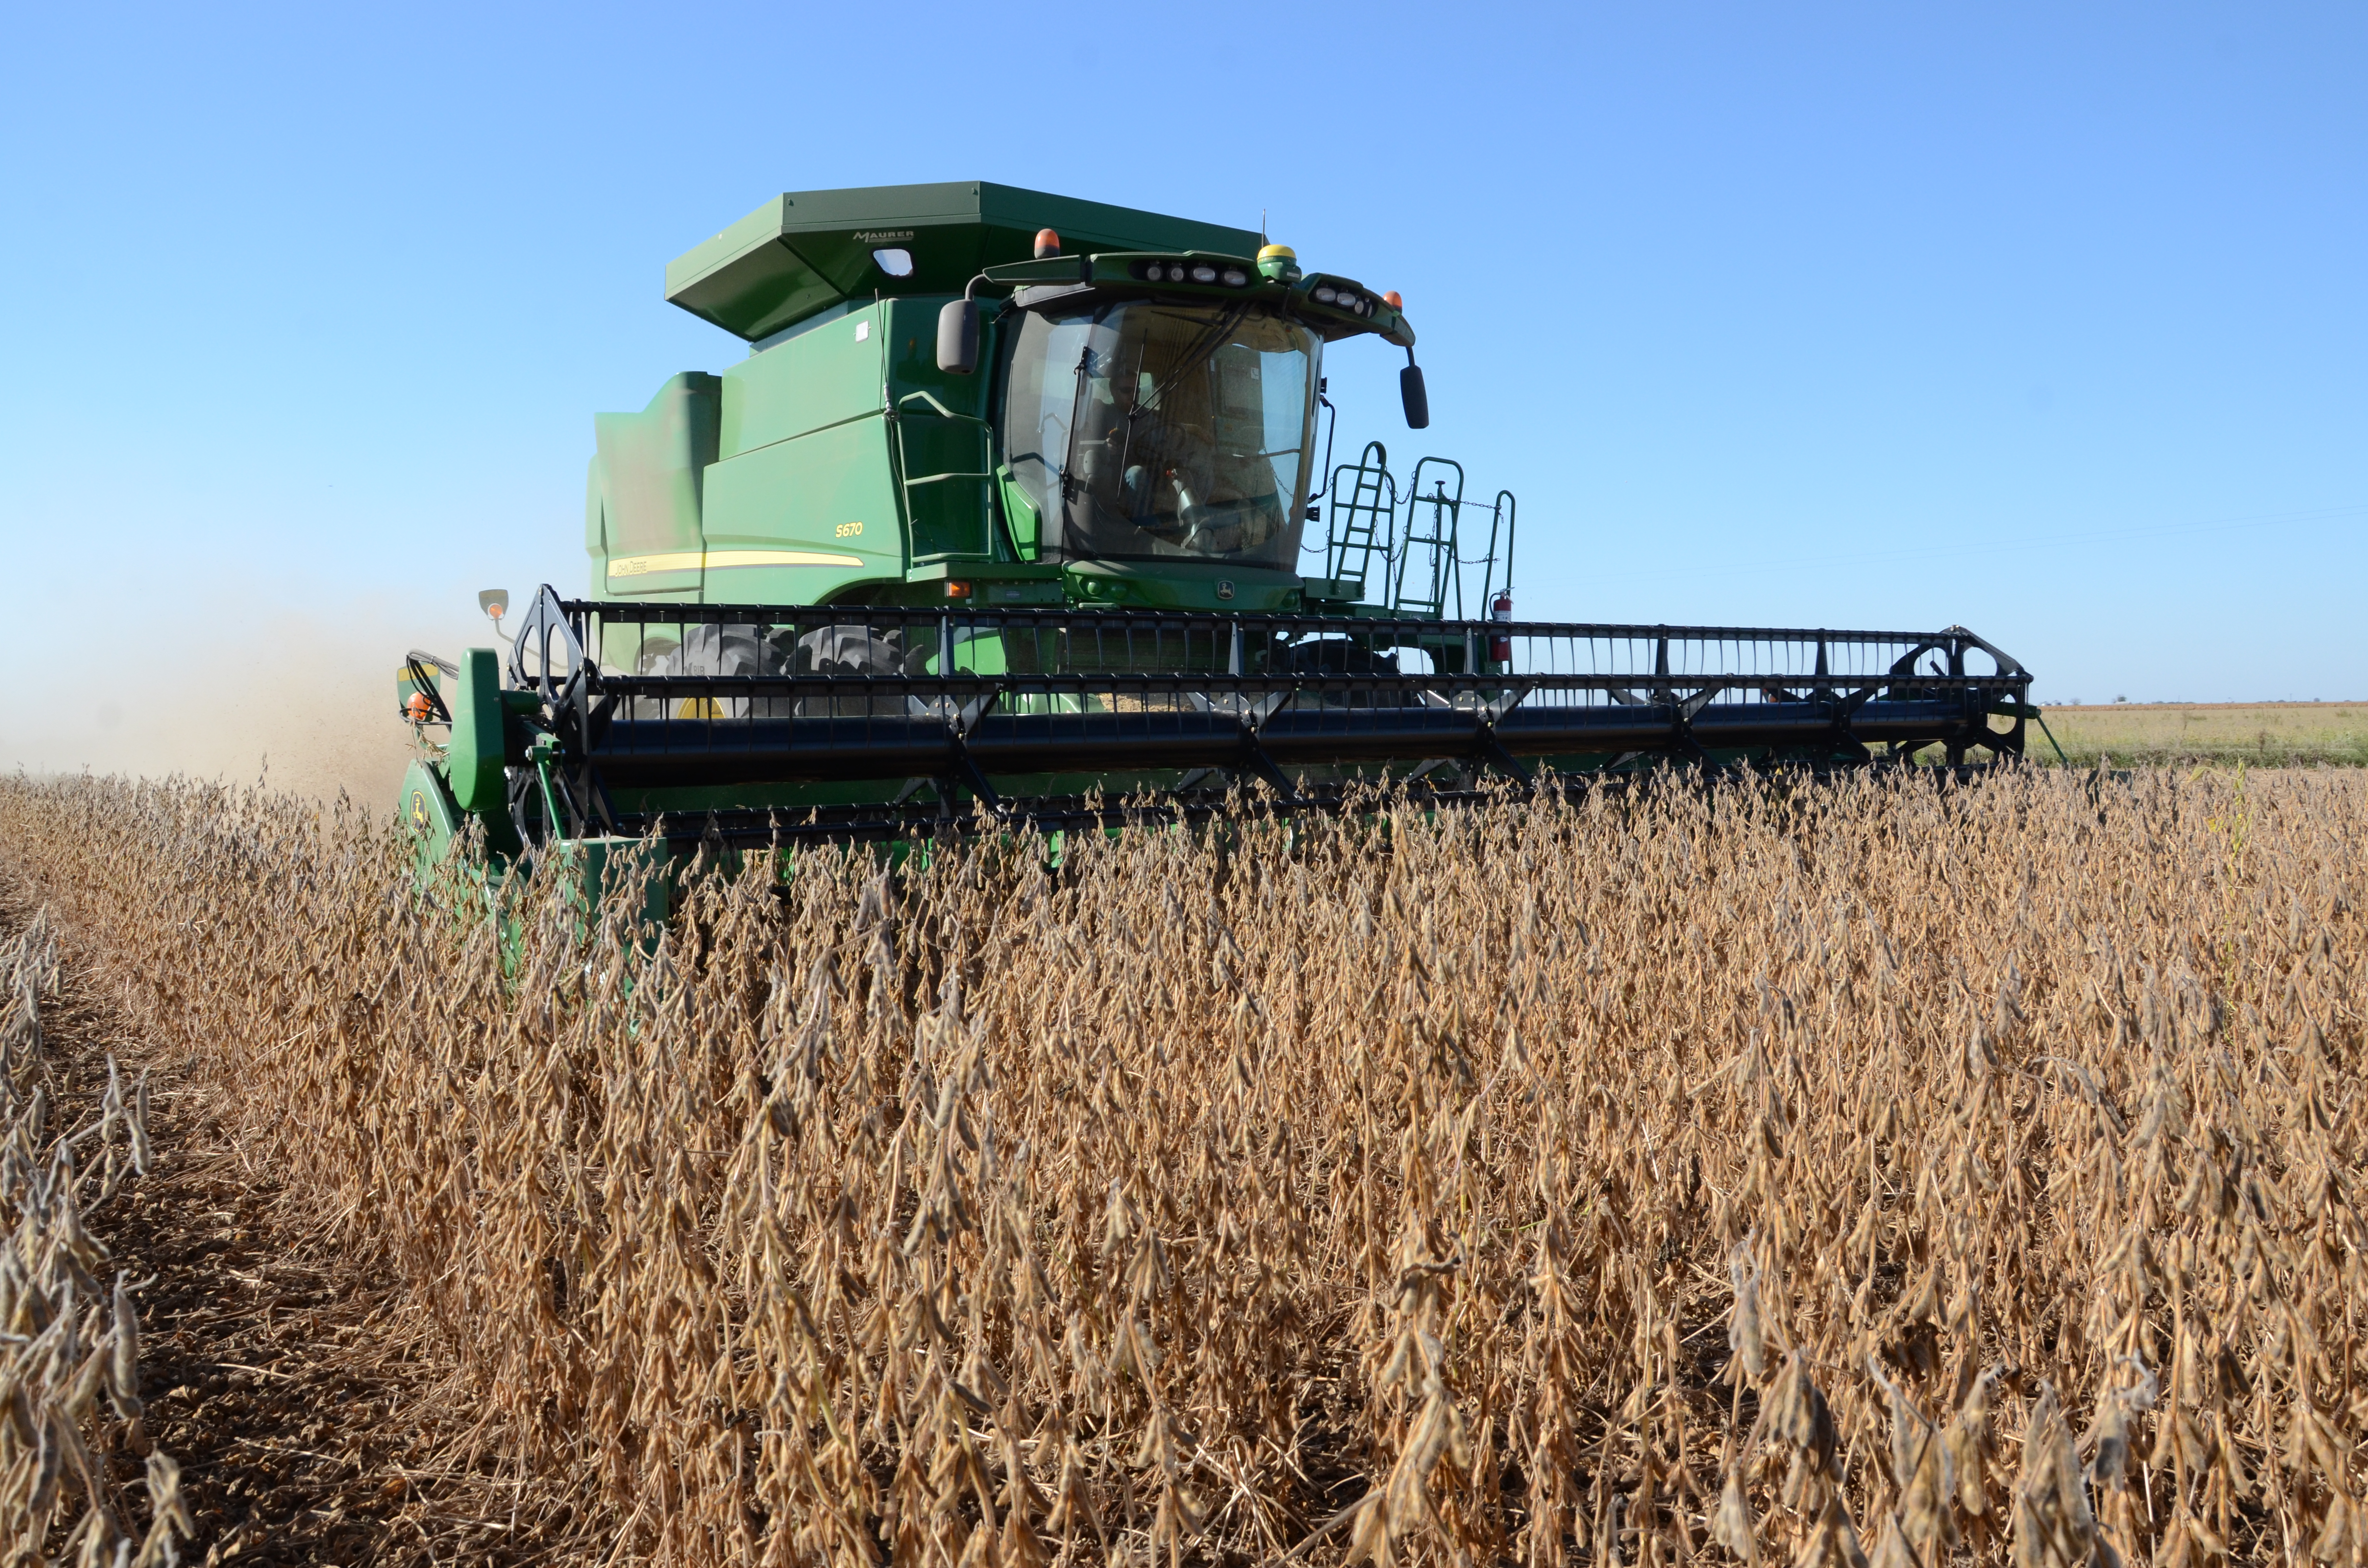 ROLLING DATA COLLECTOR: Today’s combines do far more than harvest the crop, they’ve become a key tool for gathering information about that crop that can be used for future decision-making.
“The yield monitor technology makes it really easy to do any kind of on-farm experiments,” Bowman says, advising growers to do test strips.
“With the modern equipment and computer controls on almost all of our application equipment, we can make variations in our fertilizer, our seeding, and match that up with our yield maps to do some quick research on fertility practices, on additives, and what impact they may have on your farm.”
Make strips at least one and a half times as wide as your combine header, Bowman advised, so that you get a full yield strip in that zone to represent that treatment.
Try zero rates on small blocks; you can learn a lot from those, he adds. It’s hard to know the impact of your fertility unless you have a small block with a zero rate to compare. That’ll help determine what improvements you can get from additional fertilizer and materials.
As for testing hybrids and varieties, he says, farmers are interested in how their picks this year performed in a variety of situations. An agronomist can help evaluate that.
Once you have your data, it’s critical that you check whether you had all yield monitors calibrated.
“We need to make sure we do spend some time calibrating our yield monitors in the combine and making sure that that equipment is clean, the sensors are cleaned and calibrated so that they are as accurate as possible,” Bowman says.
To calibrate, see your manufacturer’s manual or website.
“Many of our farm operations across the U.S. have the post-calibrated scale weights, meaning they know exactly how many bushels went across the scale, whether they took it into their bins or into the elevator,” Lackore says. “Being able to post calibrate and clean up yield data is critical because if we have noise in the data, that could lead to poor quality management. So, quality yield maps are very important.”
Tap the many professionals out there to help you with yield maps, whether it be your Pioneer sales representative, local agronomist or retailer, Lackore says. A key resource is Corteva’s Granular Insights.
“If we start to see consistency and productivity, meaning low-yielding areas of the field are always low yielding, or high-yielding areas of the field are always high yielding, we can then bring that all together to help us make actionable decisions,” Lackore says.
Bowman notes the value of historical patterns in yield mapping. In the Champaign, Ill., area, for example, this past year was exceptionally dry. Farmers could be keeping that information, comparing it to wet years and then looking at repeated wet years to spot drainage issues that might be solvable with tile or some type of surface drainage, he says.
“The yield map is a great tool to take to a landlord and show visually what's going on in the field and if there are problems that need to be addressed.” - Dennis Bowman
With fertility problems, Bowman says, yield mapping can help you spot historical factors that you might not see in soil fertility maps, such as old farming patterns where fields have been combined. Those histories might show up as differences in organic matter.
“The old barn lot will often show up for years or decades after the barn and the farmstead has gone; the organic matter that came from where the livestock area was may be a legacy that continues to show up in yield maps for years,” Bowman adds.
Often, Bowman says, farmers will see variations in the yield map and can't come up with a reason.
“So, then some type of ground truthing, or flagging that area for further investigation, a new round of soil tests, an SCN test, those kinds of things,” he says, “can help us track down the cause and do some detective work on what may be causing some of these variations.”
A grower’s historical knowledge and input remains key as we look at trends, Lackore says.
“As advisors, we're very good on the technology side as far as you know how to how to best maximize the yield data and put it to us,” Lackore says, “but the growers have so much intuitive knowledge about those farms.”
Being creative with technology, and turning to a trusted advisor, can help your bottom line, he says.
“The sky’s the limit,” Lackore says, “when we look at the ability to use this technology to help answer questions for each individual farm operation.”
This content produced by Farm Progress for Corteva Agriscience.